参考资料:
配置环境
基础环境
 1
 2
 3
 4
 5
 6
 7
 8
 9
10
| \documentclass{article}
\usepackage{tikz}
\begin{document}
\begin{tikzpicture}
...
\end{tikzpicture}
\end{document}
|
测试,xlatex和pdflatex均可通过
Tikz提供了 \tikz 和 \tikzpicture 环境两种。可以任意选择。
Vscode中输出SVG矢量图像
平台:VScode + Latex Workshop
在vscode插件Latex Workshop中设置latexmk编译器参数-shell-escape。
第二个链接中,How to pass -shell-escape to latexmk 给出了三种解决办法,这里使用的第一种,直接加-shell-escape参数
 1
 2
 3
 4
 5
 6
 7
 8
 9
10
11
| "name": "latexmk",
"command": "latexmk",
"args": [
"-shell-escape",
"-synctex=1",
"-interaction=nonstopmode",
"-file-line-error",
//"-pdf",
"-outdir=%OUTDIR%",
"%DOC%"
]
|
使用dvisvgm生成svg
这里使用的是vscode中latex workshop里面的批指令
在设置settings.json -> “latex-workshop.latex.tools” 中添加dvisvgm命令
1
2
3
4
5
6
7
| {
"name": "dvisvgm",
"command": "dvisvgm",
"args": [
"%DOCFILE%"
]
},
|
在settings.json -> “latex-workshop.latex.recipes” 中添加recipes:
1
2
3
4
5
6
7
| {
"name": "svg",
"tools": [
"latexmk",
"dvisvgm"
]
}
|
latex模板
1
2
3
4
5
6
| \documentclass[tikz]{standalone}
\begin{document}
\begin{tikzpicture}
...
\end{tikzpicture}
\end{document}
|
Tikz语法
基本语法
\draw 为绘图命令;后面的…为操作;[option]为选项部分,可不填。
绘制直线
基本命令
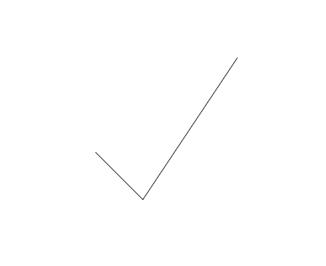
在 \draw 命令后,输入点的坐标,并使用 – 连接起来即可,
1
2
3
| \begin{tikzpicture}
\draw (1,3)--(2,2)--(4,5);
\end{tikzpicture}
|
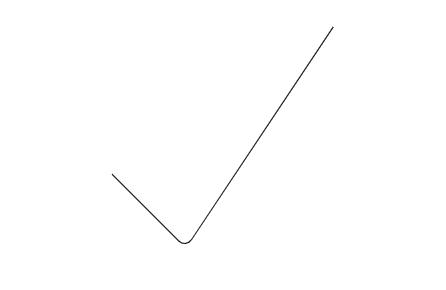
变成圆角 {[rounded corners]}
1
2
3
| \begin{tikzpicture}
\draw[rounded corners] (1,3)--(2,2)--(4,5);
\end{tikzpicture}
|
封闭图形 {cycle}
1
2
3
| \begin{tikzpicture}
\draw[rounded corners] (1,3)--(2,2)--(4,5)--cycle;
\end{tikzpicture}
|
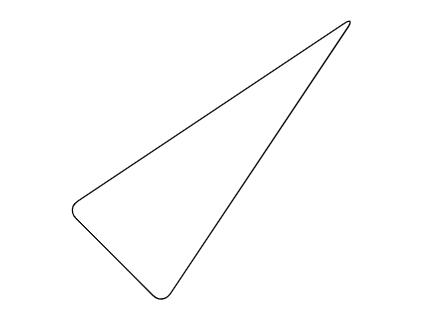
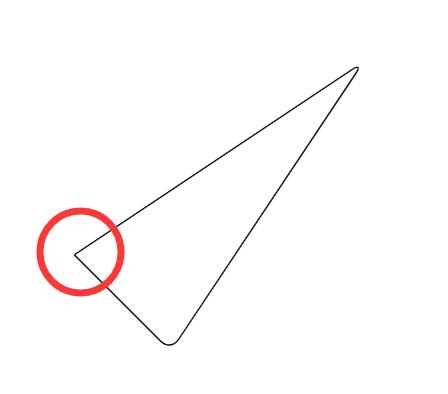
伪封闭图形:最后的连接处是不会执行圆角指令的,因为识别不出来是连接在一起的:
绘制基本图形
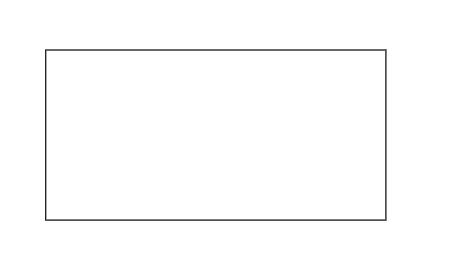
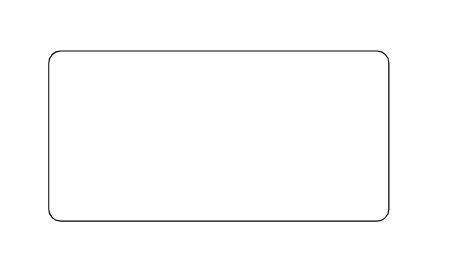
矩形 {rectangle}
参数:一对对角顶点
1
2
3
4
5
6
7
8
9
| %% 基本命令
\begin{tikzpicture}
\draw (0,0) rectangle (4,2);
\end{tikzpicture}
%% 圆角
\begin{tikzpicture}
\draw[rounded corners] (0,0) rectangle (4,2);
\end{tikzpicture}
|
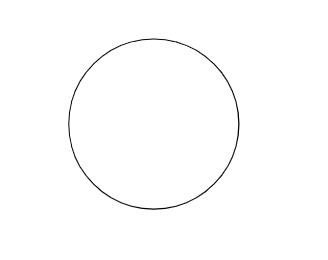
圆 {circle}
参数:圆心坐标;半径(小括号括起来)
1
2
3
4
| %% 圆心在(1,1) 半径为1的圆
\begin{tikzpicture}
\draw (1,1) circle (1);
\end{tikzpicture}
|
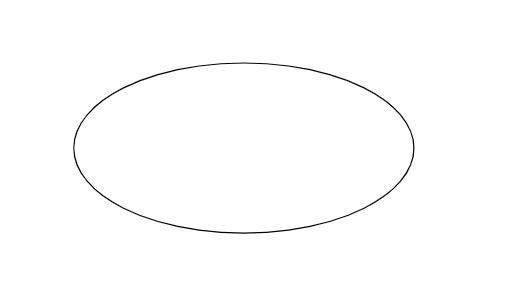
椭圆 {ellipse}
参数:重心;长轴长,短轴长(小括号括起来,使用and间隔)
1
2
3
4
| %% 重心在(1,1) 长轴长为2,短轴长为1的椭圆
\begin{tikzpicture}
\draw (1,1) ellipse (2 and 1);
\end{tikzpicture}
|
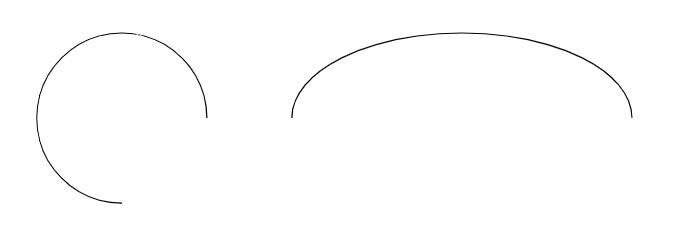
圆弧 {arc}
参数:重心(中心); 起始角度:终止角度:圆心(长轴长 and 短轴长)
1
2
3
4
5
6
| \begin{tikzpicture}
%% 绘制了圆心为(1,1),半径为1,从0°到270°的圆弧
\draw (1 ,1) arc (0:270:1);
%% 绘制了重心为(6,1),长轴2,短轴1,从0°到180°的椭圆弧
\draw (6 ,1) arc (0:180:2 and 1);
\end{tikzpicture}
|
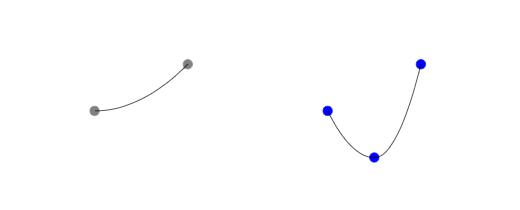
曲线
参数:控制点
和直线的画法基本一致,需要将直线的–换为..
 1
 2
 3
 4
 5
 6
 7
 8
 9
10
11
12
13
14
15
16
17
18
19
20
21
22
23
24
| \begin{tikzpicture}
%% 带一个控制点的贝塞尔曲线
\filldraw [gray] (0,0) circle (.1)
(1,1) circle (.1)
(2,0) circle (.1);
\draw (0,0) .. controls (1,1) .. (2,0);
%% 带两个控制点的贝塞尔曲线
\filldraw [blue] (3,0) circle (.1)
(4,1) circle (.1)
(5,1) circle (.1)
(5,0) circle (.1);
\draw (3,0) .. controls (4,1) and (5,1) .. (5,0);
%% 两端贝塞尔样条链接
\filldraw [red] (6,0) circle (.1)
(7,1) circle (.1)
(8,1) circle (.1)
(8,0) circle (.1)
(9,2) circle (.1)
(10,0) circle (.1);
\draw (6,0) .. controls (7,1) and (8,1) ..
(8,0) .. controls (9,2) .. (10,0);
\end{tikzpicture}
|

抛物线 {parabola}
参数:起点;终点; [顶点:bend]
 1
 2
 3
 4
 5
 6
 7
 8
 9
10
11
12
| \begin{tikzpicture}
%% 起点为(5,1) 终点为(7,2)的抛物线
\filldraw [gray] (5,1) circle (.1)
(7,2) circle (.1);
\draw (5,1) parabola (7,2);
%% 起点为(10,1) 终点为(12,2) 顶点为(11,0) 的抛物线
\filldraw [blue] (10,1) circle (.1)
(11,0) circle (.1)
(12,2) circle (.1);
\draw (10,1) parabola bend (11,0) (12,2);
\end{tikzpicture}
|
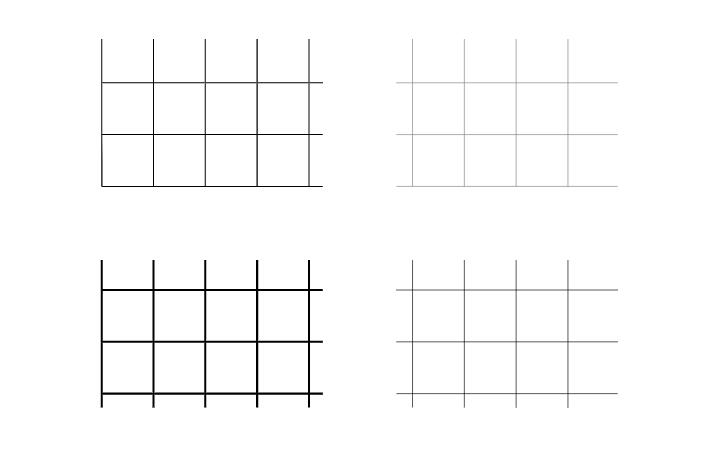
网格 {grid}
参数:起始点,步长
 1
 2
 3
 4
 5
 6
 7
 8
 9
10
| \begin{tikzpicture}
%% 左上:步长为20pt的网格
\draw [step=20pt] (0,0) grid (3,2);
%% 右上:步长为20pt,灰线为0.2pt(help lines)的网格
\draw [help lines,step=20pt] (4,0) grid (7,2);
%% 左下
\draw [thick,step=20pt] (0,-3) grid (3,-1);
%% 右下
\draw [very thin,step=20pt] (4,-3) grid (7,-1);
\end{tikzpicture}
|
选项[option]
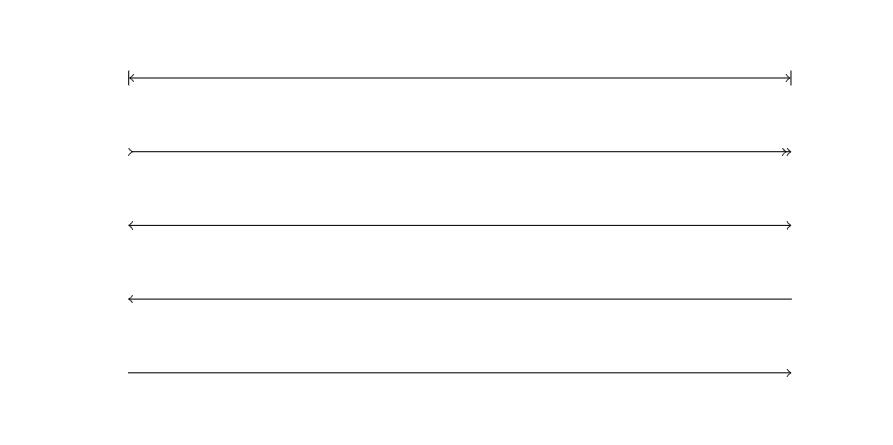
箭头
1
2
3
4
5
6
7
| \begin{tikzpicture}
\draw [|<->|] (0,4)--(9,4);
\draw [>->>] (0,3)--(9,3);
\draw [<->] (0,2)--(9,2);
\draw [<-] (0,1)--(9,1);
\draw [->] (0,0)--(9,0);
\end{tikzpicture}
|
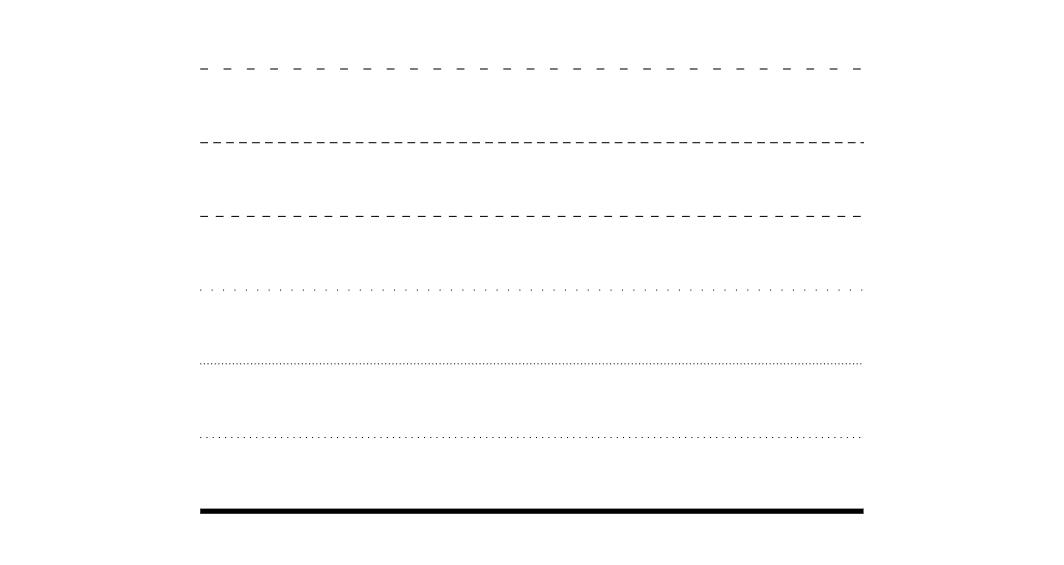
线型、线宽
1
2
3
4
5
6
7
8
9
| \begin{tikzpicture}
\draw [loosely dashed] (0,6)--(9,6); %较疏的线状虚线
\draw [densely dashed] (0,5)--(9,5); %较密的线状虚线
\draw [dashed] (0,4)--(9,4); %线状虚线
\draw [loosely dotted] (0,3)--(9,3); %较疏的点状虚线
\draw [densely dotted] (0,2)--(9,2); %较密的点状虚线
\draw [dotted] (0,1)--(9,1); %点状虚线
\draw [line width =2pt] (0,0)--(9,0); %加粗实线
\end{tikzpicture}
|
变形
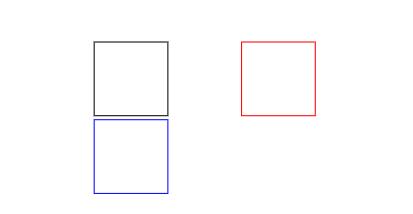
平移
首先需要定义一个基础图形,然后所有的移动都是相对这个基本图形来的
1
2
3
4
5
6
7
8
| \begin{tikzpicture}
%% 首先定义一个基础图形
\draw (0,0) rectangle (1,1);
%% 平移shift,根据基本图形向右平移2个单位
\draw[shift={(2,0)},color=red] (0,0) rectangle (1,1);
%% 沿y轴平移,根据基本图形向下平移,默认单位是pt;沿x轴平移同理
\draw[yshift=-30, color=blue] (0,0) rectangle (1,1);
\end{tikzpicture}
|
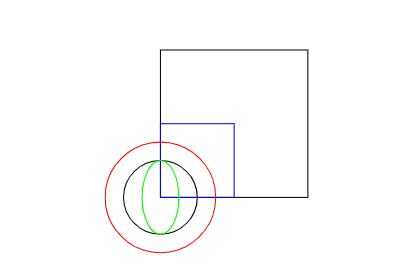
缩放
缩放的中心是按照起始点进行缩放
1
2
3
4
5
6
7
8
9
| \begin{tikzpicture}
\draw (0,0) rectangle (2,2);
\draw (0,0) circle (.5);
%% 整体缩放,是按照起始点进行缩放
\draw [scale =.5, color = blue] (0,0) rectangle (2,2);
\draw [scale =1.5, color = red] (0,0) circle (.5);
%% 单个方向进行缩放
\draw [xscale =.5, color = green] (0,0) circle (.5);
\end{tikzpicture}
|
旋转
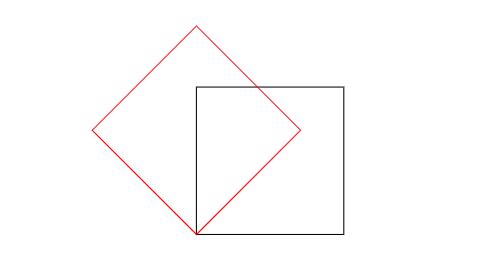
旋转的数值是角度,正数表示逆时针选咋混的相应角度。旋转中心是起始点
1
2
3
4
5
| \begin{tikzpicture}
\draw (0,0) rectangle (2,2);
%% 逆时针旋转45°
\draw[rotate =45, color = red] (0,0) rectangle (2,2);
\end{tikzpicture}
|
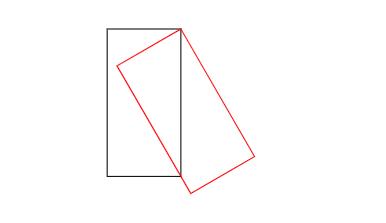
指定点进行旋转
1
2
3
4
5
| \begin{tikzpicture}
\draw (0,0) rectangle (1,2);
%% 将整个图形以(1,2)点为中心进行逆时针旋转30°
\draw[rotate around ={30:(1 ,2)}, color = red] (0,0) rectangle (1,2);
\end{tikzpicture}
|
颜色和填充
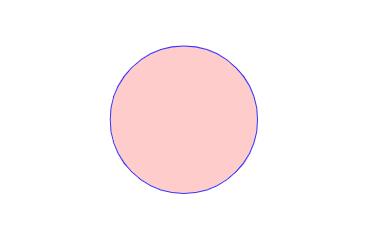
使用\filldraw命令可以填充图形,在选项中指定线条和填充的颜色
1
2
3
4
5
6
| \begin{tikzpicture}
%% 画一个中心点为(0,0)半径为1的圆
%% 线条颜色是蓝色,透明度是80%
%% 填充颜色是红色,透明度是20%
\filldraw[draw=blue!80,fill=red!20] (0,0) circle (1);
\end{tikzpicture}
|
样式
全局样式
在\begin{document}之前使用\tikzset指定样式
 1
 2
 3
 4
 5
 6
 7
 8
 9
10
11
12
13
| \documentclass{article}
\usepackage{tikz}
%% 样式名称:dline;内容:颜色为蓝;线宽2pt
\tikzset{
dline/.style ={color = blue, line width =2pt}
}
\begin{document}
\begin{tikzpicture}
\draw[dline] (0,0) --(9,0);
\end{tikzpicture}
\end{document}
|

局部样式
在\begin{tikzpicture}后使用[]添加局部样式选项
1
2
3
4
5
6
7
8
| \documentclass{article}
\usepackage{tikz}
\begin{document}
%% 局部样式,名称:miao;内容:颜色为红色,线条宽度2pt
\begin{tikzpicture}[miao/.style ={color=red,line width =2pt}]
\draw[miao] (0,0) --(9,0);
\end{tikzpicture}
\end{document}
|

节点 (node)
确定节点的样式
 1
 2
 3
 4
 5
 6
 7
 8
 9
10
| \tikzset{
box/.style ={
rectangle, %矩形节点
rounded corners =5pt, %圆角
minimum width =50pt, %最小宽度
minimum height =20pt, %最小高度
inner sep=5pt, %文字和边框的距离
draw=blue %边框颜色
}
}
|
| 名称 | 选项 | 默认值 | 说明 |
|---|
| 内边距 | inner sep | .333em | 文本与边框之间的距离 |
| 水平内边距 | inner xsep | .333em | 文本与边框之间的距离(水平方向) |
| 垂直内边距 | inner ysep | .333em | 文本与边框之间的距离(垂直方向) |
| 外边距 | outer sep | no | 边框之外的无形边距 |
| 水平外边距 | outer xsep | .5pgflinewidth | 边框之外的无形边距(水平方向) |
| 垂直外边距 | outer ysep | .5pgflinewidth | 边框之外的无形边距(垂直方向) |
| 最小高度 | minimum height | 0pt | 节点的最小高度,如果文本和内边距的高度小于最小高度,节点自动增大为最小高度 |
| 最小宽度 | minimum width | 0pt | 节点的最小宽度,如果文本和内边距的高度小于最小宽度,节点自动增大为最小宽度 |
| 节点大小 | minimum size | no | 节点最小大小,节点的高度和宽度自动大于该值 |
| 宽高比 | shape aspect | no | 节点形状的宽高比 |
| 旋转节点 | rotate | no | 旋转整个节点 |
| 旋转边框 | shape border rotate | no | 旋转节点的边框 |
| | | |
利用节点画流程图
 1
 2
 3
 4
 5
 6
 7
 8
 9
10
| \begin{tikzpicture}
\filldraw[gray] (0,0) circle (.1);
\node[box] (b1) at(0,0) {A};
\node[box] (b2) at(4,0) {B};
\node[box] (b3) at(8,0) {C};
\draw[->] (b1)--(b2);
\draw[->] (b2)--(b3);
\node at(2,1) {a};
\node at(6,1) {b};
\end{tikzpicture}
|
- \node[box] 指明了使用box风格的节点
- (b1) 指明了节点的名字
- at(0,0) 指明了节点的位置,位置为中心点
- {A} 指明节点的文字

图中画了三个box节点,之后使用箭头连接起来。然后画了两个没有名字和边框的节点。
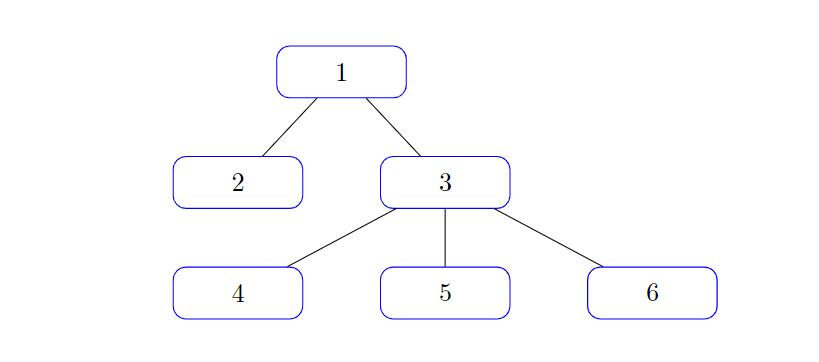
子节点
使用 \child 关键词来声明子节点。相邻节点之间的间距可以使用sibling distance控制。
1
2
3
4
5
6
7
8
9
| \begin{tikzpicture}[sibling distance =80pt]
\node[box] {1}
child { node[box] {2}}
child { node[box] {3}
child {node[box] {4}}
child {node[box] {5}}
child {node[box] {6}}
};
\end{tikzpicture}
|
插入外部图片
\begin{tikzpicture}
\node at (0,0) {\includegraphics[width=5cm,height=2cm]{pass.png}};
\end{tikzpicture}
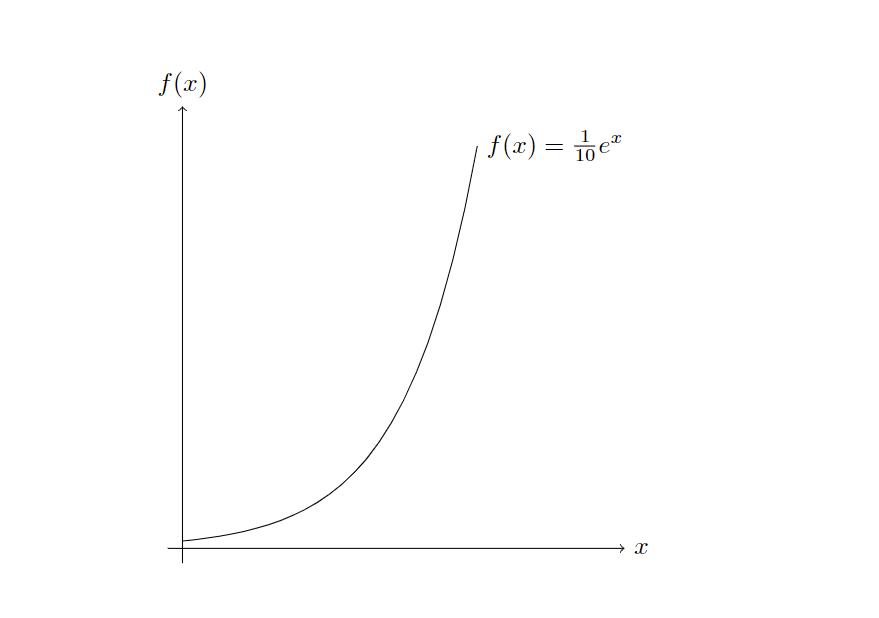
绘制函数
\begin{tikzpicture}
    \draw[->] (-0.2,0) --(6,0) node[right] {$x$};
    \draw[->] (0,-0.2) --(0,6) node[above] {$f(x)$};
    \draw[domain=0:4] plot (\x,{0.1* exp(\x)}) node[right] {$f(x)=\frac{1}{10}e^x$};
\end{tikzpicture}
- domain = 0:4 设置了绘图的范围是0-4
- plot 是绘制操作
- node[right]{} 表示文字在箭头的右面,{}为文字内容
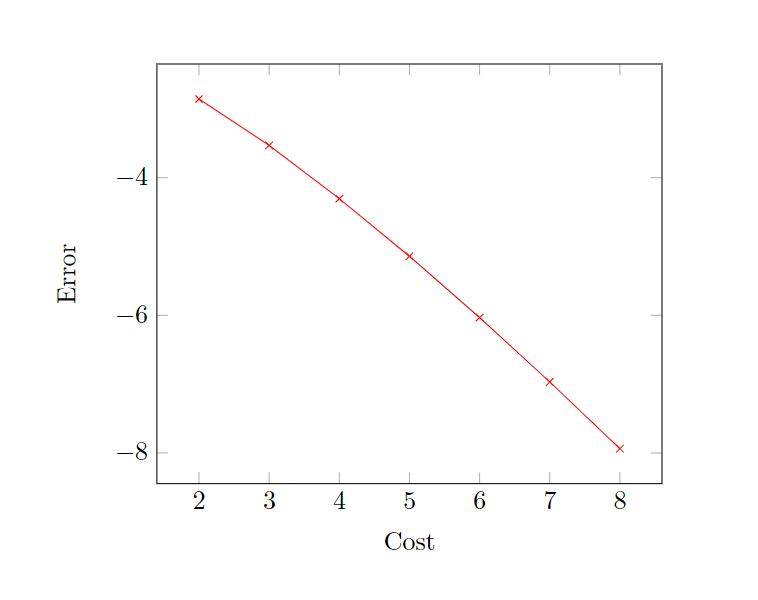
推荐pgfplots画函数:
http://pgfplots.sourceforge.net/gallery.html
 1
 2
 3
 4
 5
 6
 7
 8
 9
10
11
12
13
14
15
16
17
18
19
| \documentclass{article}
\usepackage{pgfplots}
\begin{document}
\begin{tikzpicture}
\begin{axis}[
xlabel=Cost,
ylabel=Error]
\addplot[color=red,mark=x] coordinates {
(2,-2.8559703)
(3,-3.5301677)
(4,-4.3050655)
(5,-5.1413136)
(6,-6.0322865)
(7,-6.9675052)
(8,-7.9377747)
};
\end{axis}
\end{tikzpicture}
\end{document}
|
